Aqueduct Consultancy


Design Standards
How do we determine the efficiency of a sports turf irrigation system?
Irrigation system efficiency is measured by how evenly the irrigation system distributes water over the area to be irrigated. This determination takes into consideration only the mechanical function of the application of water over the irrigated area. There are of course many other factors which have an impact on the effectiveness of the application of water, such as the prevailing environmental factors and the soil characteristics etc. but the irrigation designer has no direct control over these factors in the act of designing an irrigation system so we are content here to deal only with the mechanical factors.
Coefficients of Uniformity and Distribution:
Traditionally the units of measurement used to express the efficiency of an irrigation system have been the Coefficient of Uniformity (Cu) and the Distribution Uniformity (Du). These have been the units of measure for irrigation efficiency for many years now and were originally used primarily for agricultural irrigation applications and were formulated when impact sprinklers were the most common type of sprinkler in use.
The primary function of these measurements is for use in determining irrigation schedules. The efficiency of the irrigation system will determine how long it will be necessary to operate the irrigation system in order to effectively apply a pre-determined amount of water to the irrigated area. A perfect irrigation system with a 100% efficiency rating and an application rate of 10mm/Hr. will need to run for one hour in order to apply 10mm of water to the irrigated area. An irrigation system with a lower efficiency of say 50% will need to run for two hours in order to ensure the 10mmm application to the dryer portions of the irrigated area.
Scheduling Coefficient:
More recently it has become increasingly acceptable to use a thing called a scheduling coefficient in determining the efficiency of irrigation systems and for scheduling for sports turf irrigation applications in particular. The scheduling coefficient is a measure of how much additional water must be applied to the driest 5% contiguous area of a given sprinkler pattern in order to equal the average application of the entire area. In simple terms the scheduling coefficient is a measure of how much additional water must be applied to provide enough water for the dry areas.
The adoption of the scheduling coefficient as the primary tool for determining irrigation schedules for sports turf may tend to result in a slightly higher water application than other means but in this industry we are trying to achieve an ideal aesthetic result. In the sports turf industry we are not just trying to get the grass to grow; we are trying to get the grass to present perfectly and be ideally fit for purpose. We actually have a responsibility to provide a playing surface that is both aesthetically acceptable and safe to use so there is a willingness to sacrifice some increase in water consumption in order to achieve those basic aims.
Pressure differential between heads:
Another major factor to be considered in determining the efficiency of an irrigation system is the difference in operating pressures between heads, both on the same lateral line, and across the entire system. If sprinklers are operating at different pressures the application rate and distribution uniformity will vary between those heads. This will also reduce the efficiency of the irrigation system.
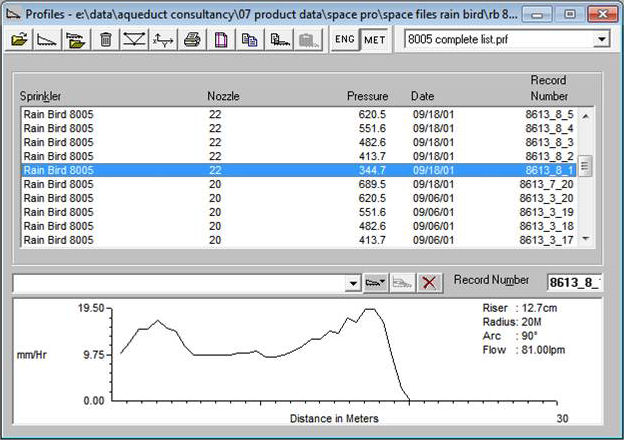
Why is the pressure differential so important? The following Screen Shots from Space Pro® demonstrate the difference in application from the sprinkler at different pressures.
Sample A: Rainbird 8005 with #22 nozzle @344.7kPa
Sample B: Rainbird 8005 with #22 nozzle @551.6kPa
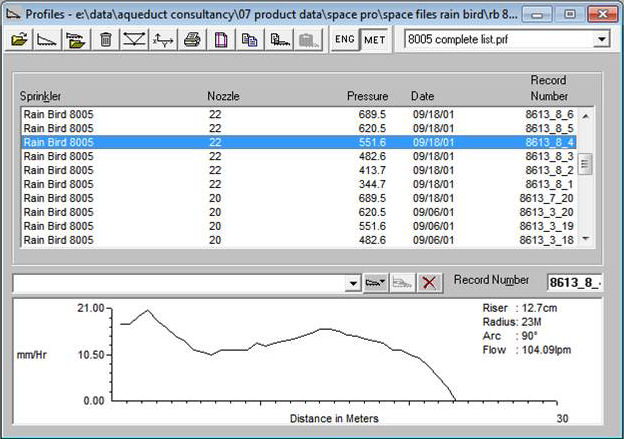
While the above examples are very dramatic and the difference in distribution is clearly evident this is not an unusual situation. I have seen many designs and systems where the in field situation is much worse than this example.
Some Base Numbers
Just so we have some basic parameters to consider I want to provide you with some basic starting points as far as the currently accepted standards are concerned. In the past when our industry standards were primarily devised from the agricultural irrigation industry; figures in the order of 65-70% Cu and Du were in many cases considered acceptable. More recently the accepted levels for sports turf applications have risen to the 75-80% range. Additionally the level of acceptance in many instances for the Scheduling Coefficient for sports turf applications has been in the order of 1.4 – 1.5.
The long term industry standard for the pressure differential between heads has been + or – 20%. This figure is outdated and was probably a very poor choice even for the agricultural industry applications from which it was derived. Much better differentials than this can be achieved through good design.
I believe these standards are not what they should be and I have been able to demonstrate that we can do much better, and more importantly, doing better can be very financially beneficial to sports turf owners and managers.
The purpose of this presentation is to point out the step up in standards which we have implemented in our design processes and the advantages this will bring to our clients; the sports turf managers and owners of Australia. This will be achieved by demonstrating the difference in outcomes of an irrigation system which meets the currently accepted industry standards for irrigation systems and a system which meets the far more exacting standards set by Aqueduct Consultancy.
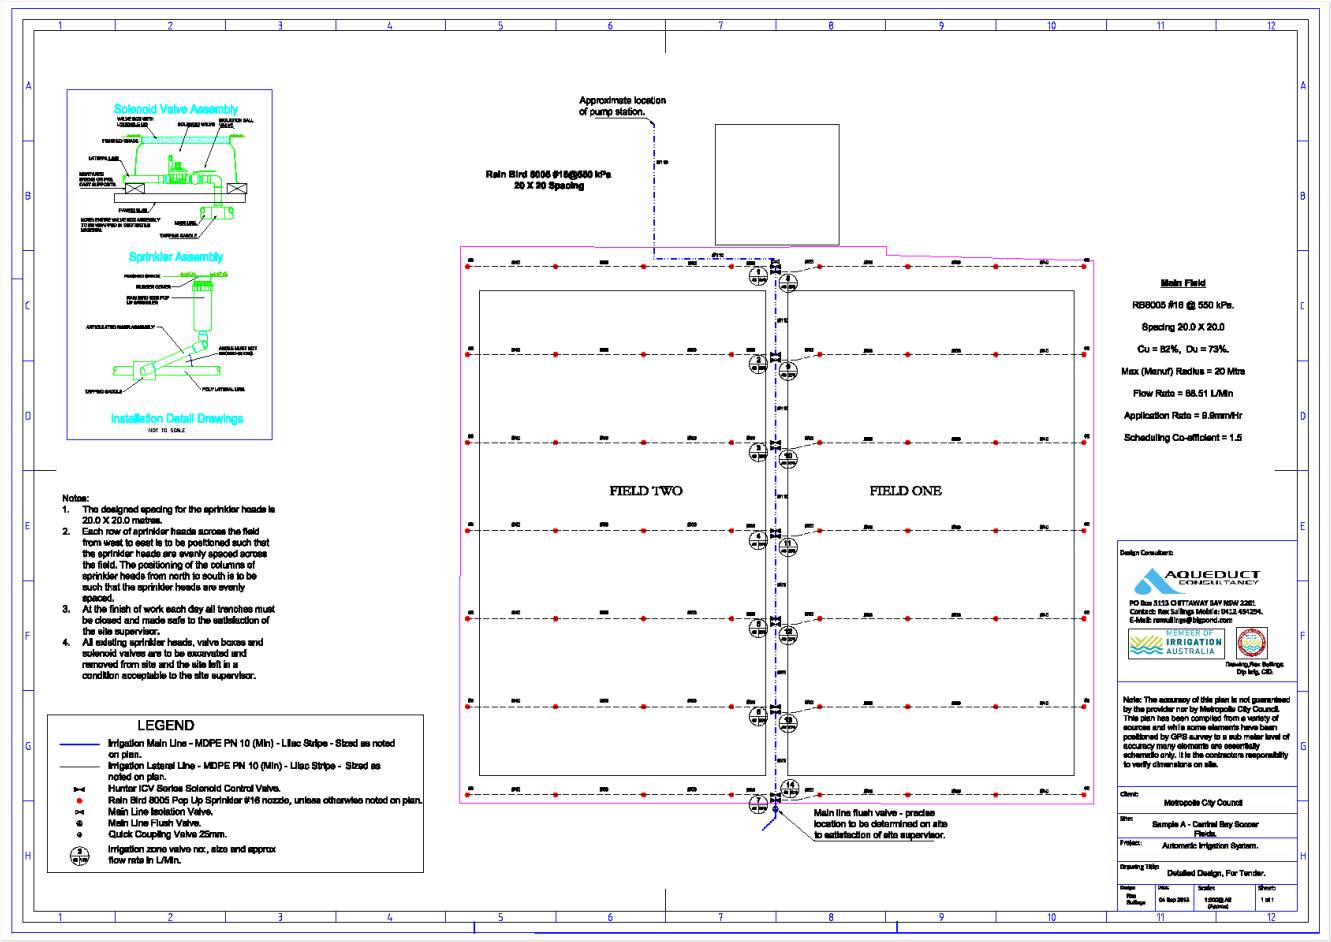
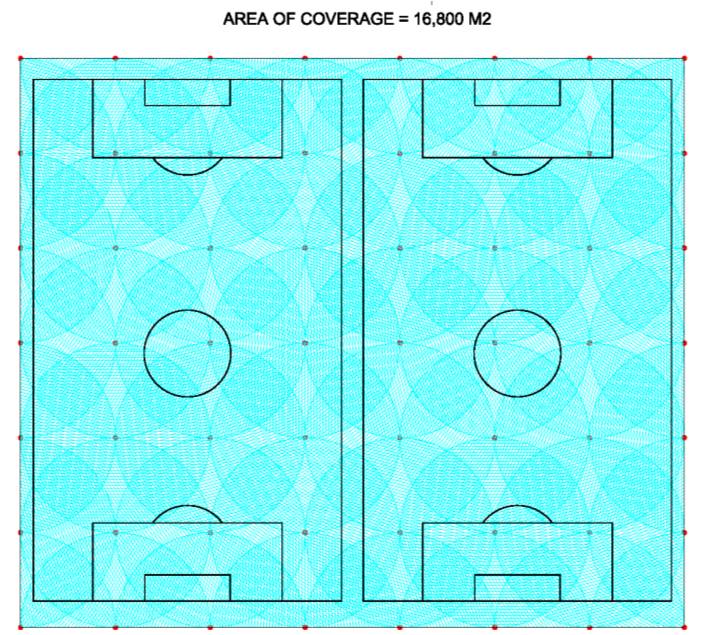
Sample A:
A design generated to represent the best of contemporary designs – a generally accepted industry standard design which meets the generally accepted requirements of the industry today.
Features:
- Sprinkler – Rain Bird 8005 #16 Nozzle operating pressure of 550kPa.
- (Matched precipitation nozzles for part circle heads).
- Spacing – 20.0 X 20.0 Mtrs. (Head to head).
- Radius of Coverage - 20 Mtrs (Manufacturer’s figures).
- Application Rate - 9.9mm/Hr.
- Flow rate per head – 68.5Ltrs/Min (#16 nozzles, #8 for selected part circles).
- Coefficient of Uniformity - 82%.
- Distribution Uniformity - 73%.
- Pressure variation between heads – 6.47 to 6.52%
- Scheduling Coefficient – 1.5.Scheduling Coefficient – 1.5.
Notes:
Our assessment of the performance indicators of Cu, Du and SC here only takes into consideration the main part of the field. There has been no allowance for the much poorer performing border areas where the sprinklers are fitted with “matched precipitation rate” nozzles which have a shorter throw than the full circle sprinklers so do not cover the same area as the full circle sprinklers. The application rates and distribution uniformity of these sprinklers are different to the full circle heads so these border areas will have much worse performance characteristics than the main area.
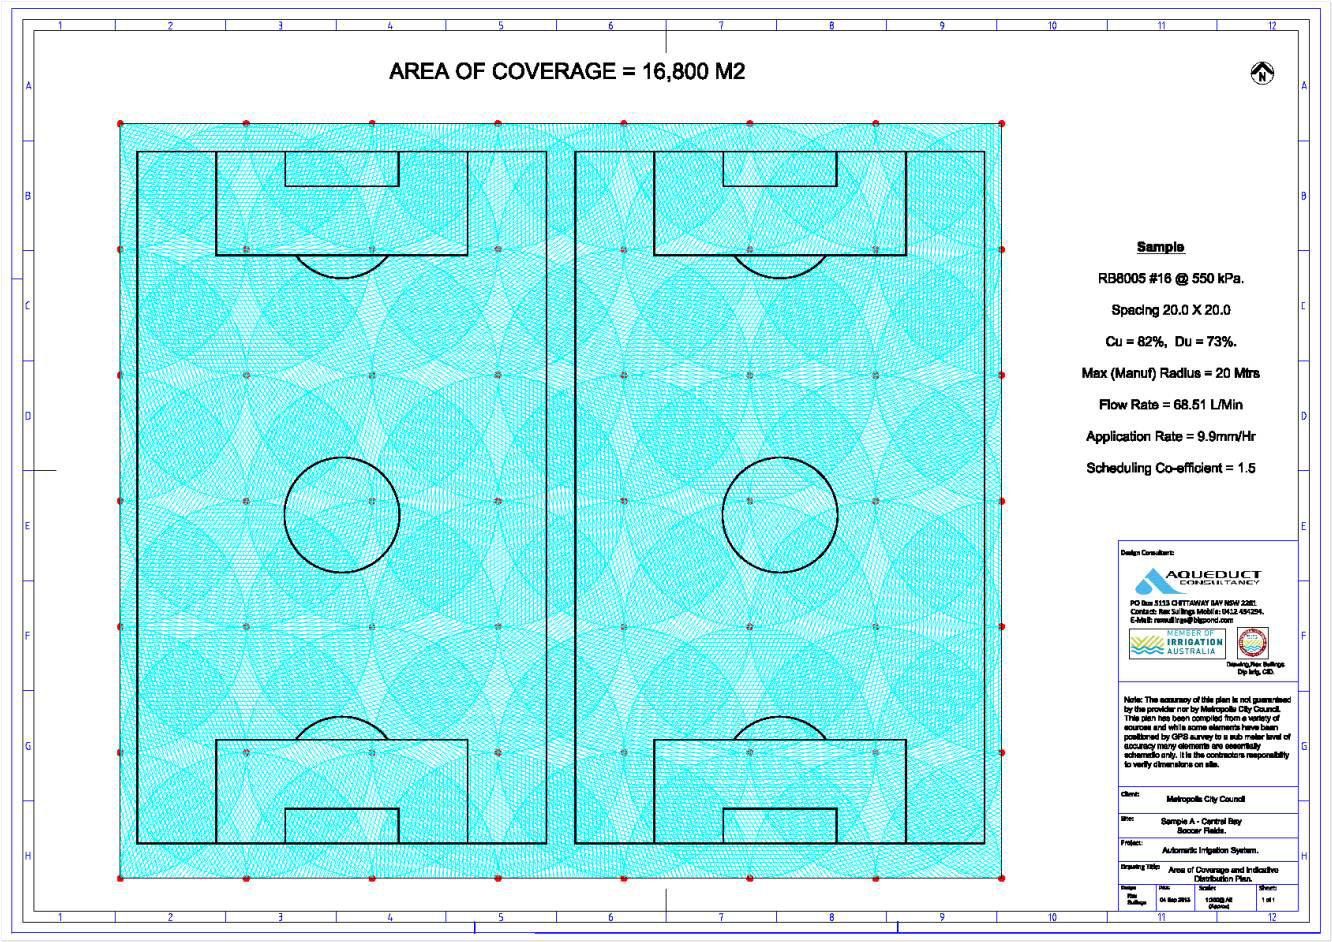
While Sample A has quite good performance figures it still has large areas of much lower performance despite being acceptable by today’s standards.
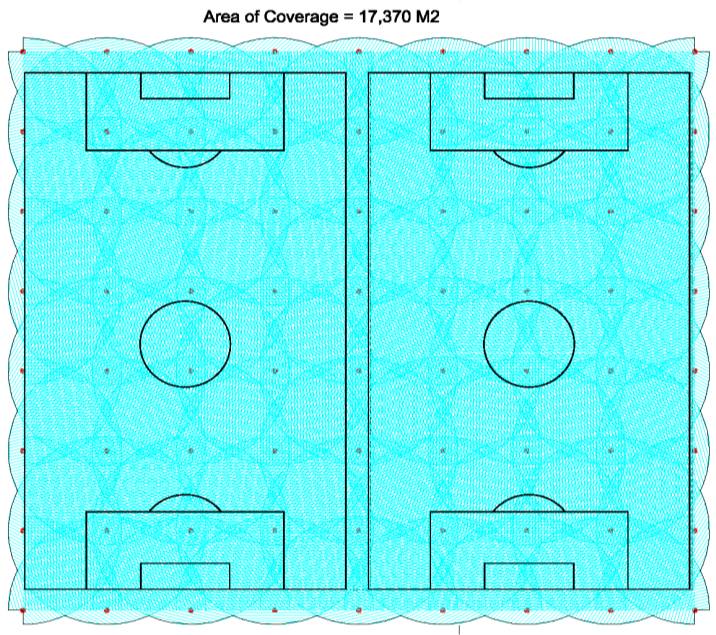
Sample B:
Aqueduct Consultancy design intended to maximise water efficiency and reduce cost of ownership.
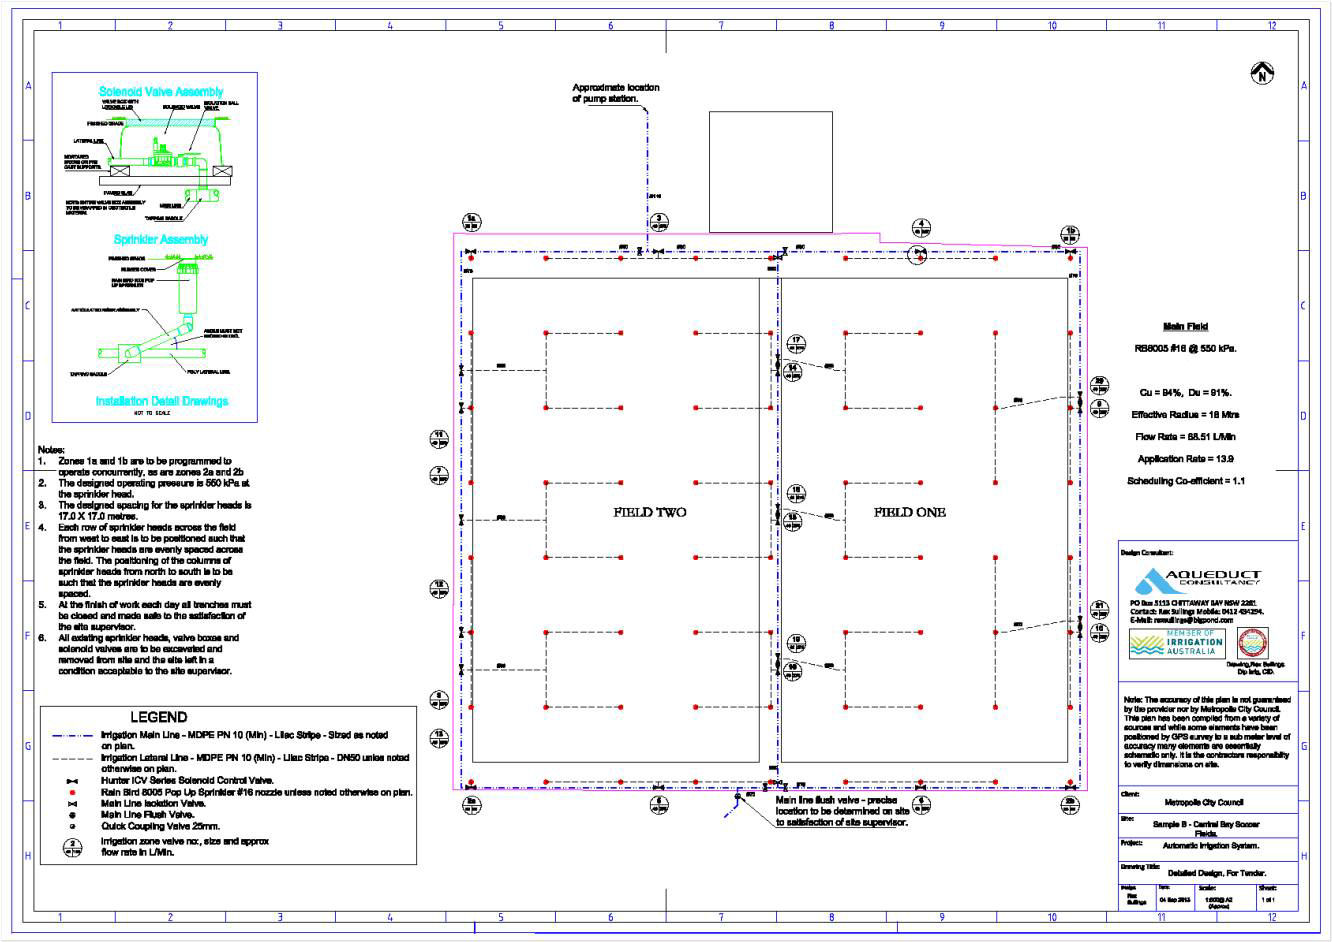
Features:
- Sprinkler – Rain Bird 8005 #16 Nozzle operating pressure of 550kPa.
- All heads have the same nozzle.
- Spacing – Calculated by Aqueduct Consultancy.
- Part circle heads valved separately. (Radius of throw, application rates and distribution uniformity matches for all heads).
- Radius of Coverage - 20 Mtrs (Manufacturer’s figures).
- Designed Radius of Coverage 18.5 Mtrs.
- Application Rate – 13.7mm/Hr.
- Flow rate per head – 68.5Ltrs/Min.
- Coefficient of Uniformity - 94%.
- Distribution Uniformity - 92%.
- Pressure variation between heads – 0 to 0.66%
- Scheduling Coefficient – 1.1.
Notes:
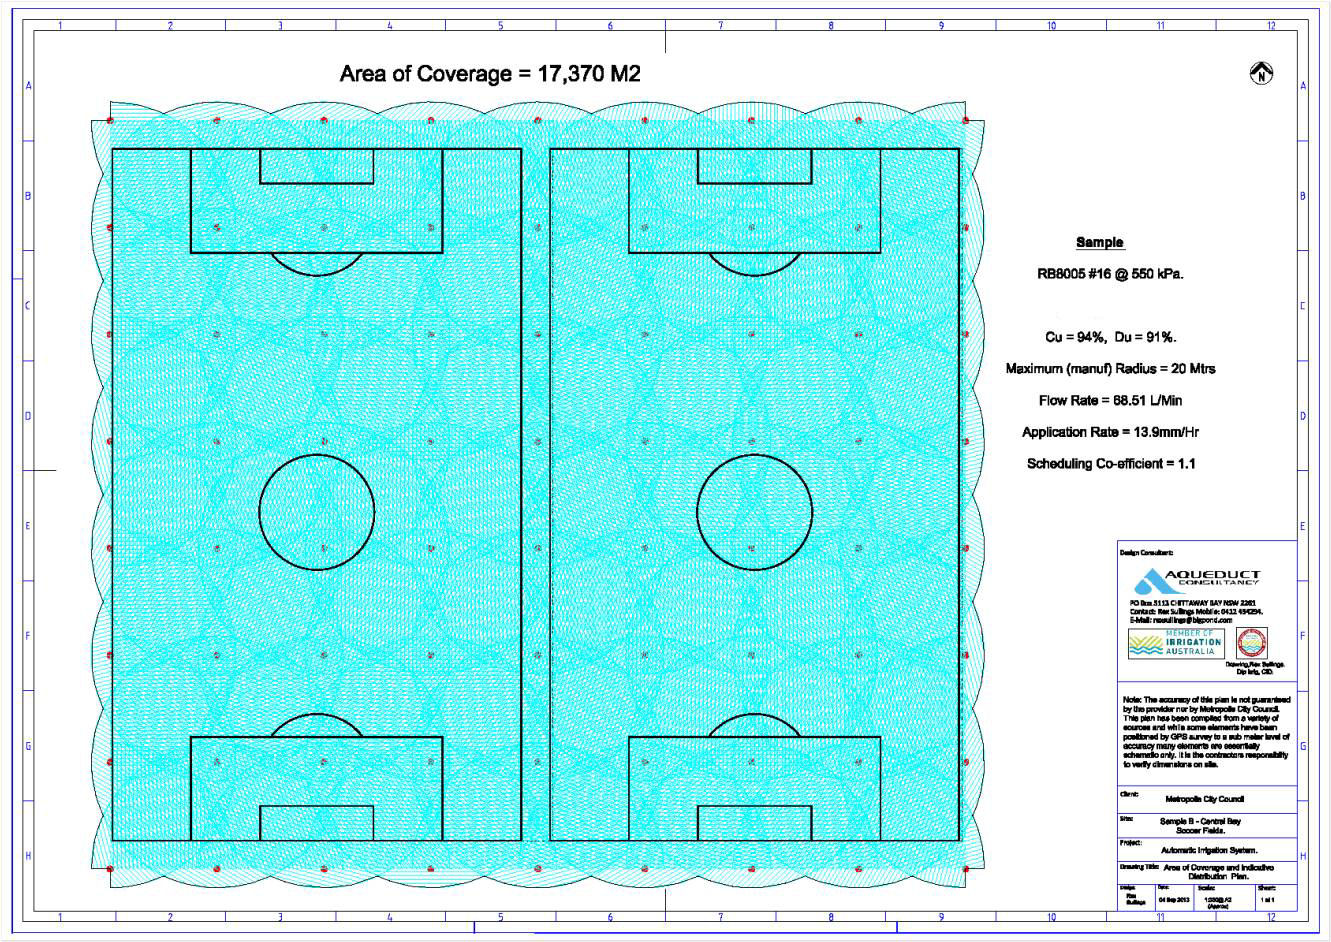
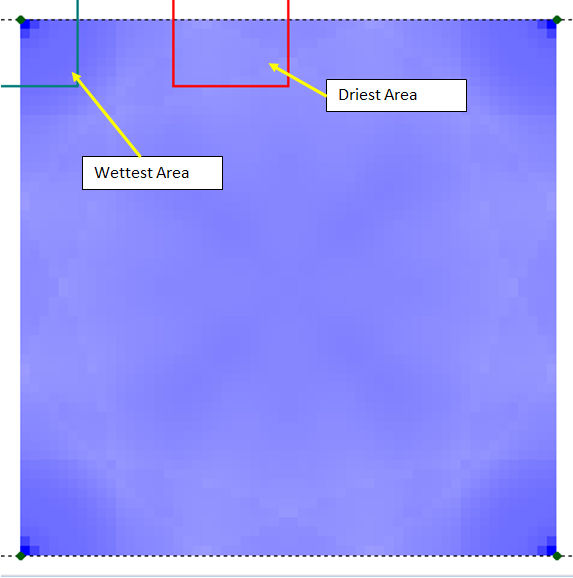
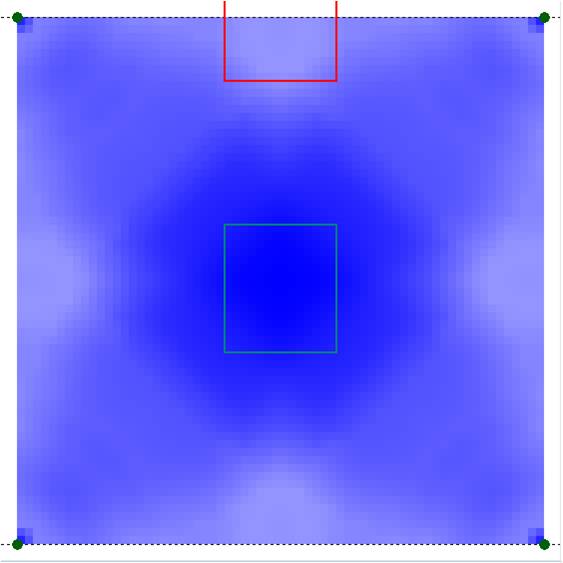
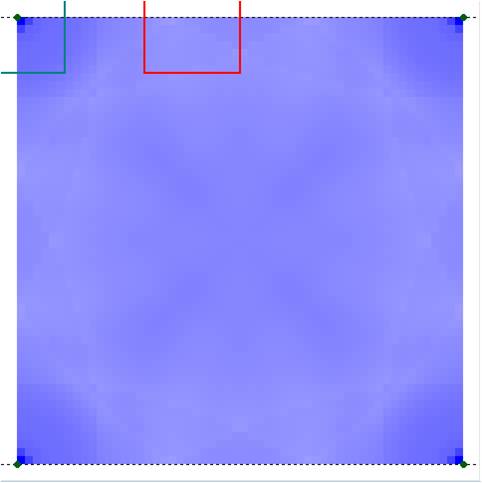
As all nozzles are the same size they also have the same application rate and distribution uniformity resulting in far more even coverage over the entire irrigated area. Also note the relative sizes and intensity of the wettest areas, far smaller in sample B.
What we have shown here is a comparison between a contemporary design, which generally meets the currently acceptable industry standards, not a really poorly designed system and a standard Aqueduct Consultancy system which meets our far more precise and exacting standards.
This is an irrigation System Designed to the new Aqueduct Consultancy Standards.
The vastly improved key performance indicators mean that this system is not only far more effective, this system also delivers dramatic efficiencies of water usage and costs of ownership.
Direct Comparison – Indicative Distribution.
 |
 |
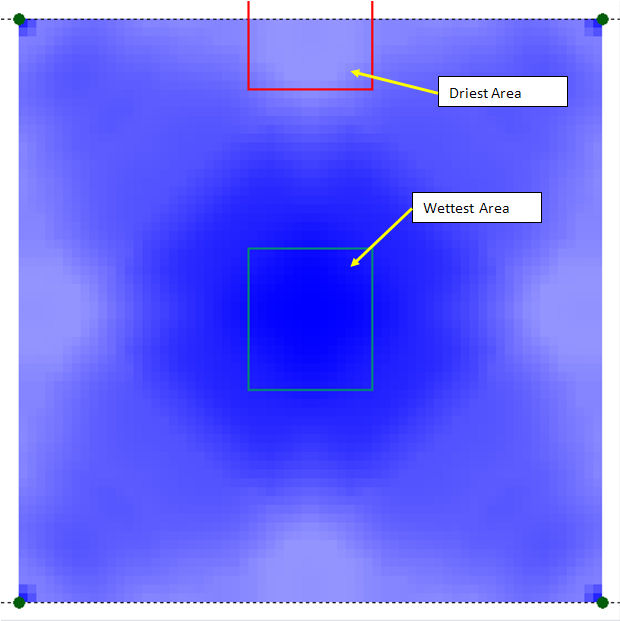
Direct Comparison – Distribution Densogram.
 |
 |
Summary of Performance Indicators.
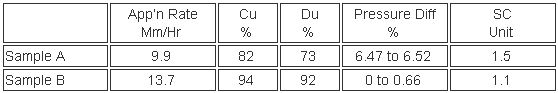
While sample A has performance indicators which are very good by contemporary industry standards for the Coefficient of Uniformity and Distribution Uniformity it has a single shortcoming in that the Scheduling Coefficient is quite high at 1.5. In this particular case it is even higher than the 1.3 we mentioned earlier as the industry acceptable standard, despite the otherwise good performance indicator figures.
By far the most important number here is the Scheduling Coefficient, which will ultimately determine how much water will need to be applied to the irrigated area. This in turn will determine how much the system will cost to own over the life expectancy of the irrigation system. Basically the owner of Sample A will need to apply 40% more water than the owner of Sample B in order to apply any given amount of water at an acceptable level of effectiveness.
Cost of Ownership
Capital Costs:
A costing has been applied to both Sample A and Sample B using the same costs for common items. In fact the vast majority of items are common with only a couple of items in Sample B which are different from those for Sample A. For example there are no 25mm solenoid valves in Sample A at all but there are 4 such items in Sample B. Other than these few different items the remainder of the cost difference is in the quantities of materials.
The estimated cost of construction for Sample A is $74,660.00 as against the estimated cost of Sample B at $96,220.00. This is a cost difference of $21,560.00 or 29 %( Approx.). These estimates of cost are inclusive of all materials and labour required including head works such as pump station and all control system components.
This may seem a large increase in capital costs but this is just the initial cost of the systems. We need to look a little further so we will move on to the cost of ownership over the life expectancy of the irrigation system of say 25 years. Then we will have a clearer idea of the actual cost of the two sample irrigation systems.
Cost of Water.
To determine the cost of water in terms of water usage we need to make some calculation of what the water requirement for the site will be. In simple terms we can do this by estimating the amount of supplemental water the site will need.
Supplemental watering is the water that will need to be applied in addition to the natural rainfall received. The estimated supplemental water requirement for sports fields in the Sydney Metropolitan area for example is approximately 450mm per annum. This of course will vary quite significantly with weather conditions during the period of assessment but this figure is based on a median rainfall and evapotranspiration year for the Sydney area so we will use this figure for our cost of ownership calculations.
The actual water requirement and life cycle cost of the two sample irrigation systems can be calculated as follows:
| Annual water requirement | = Irrigated Area (M2) X 450(mm) / 1000 X SC |
| = ## Kilolitres | |
| Annual cost of water @ $2.25/Kl | = ## X $2.25 |
| = $## |
For Sample A the Annual Water Requirement and cost is:
| Annual water requirement | = 16,800 (M2) X 450 (mm) / 1000 X 1.5 |
| = 11,340 Kilolitres | |
| Annual cost of water @ $2.25/Kl | = 20,160 X $2.25 |
| = $25,515.00 |
For Sample B the Annual Water Requirement and cost is:
| Annual water requirement | = 17,370 (M2) X 450 (mm) / 1000 X 1.1 |
| = 8,598 Kilolitres | |
| Annual cost of water @ $2.25/Kl | = 15,285 X $2.25 |
| = $19,346 |
Note:
The irrigated area of Sample B has included the fringe areas where the irrigation system actually waters marginally beyond the principal target area. These areas actually receive less water than any other portion of the site as they are at the extremities of coverage of the sprinklers and are irrigated by a single sprinkler while the remaining areas are irrigated by a number of sprinklers. These areas actually receive a negligible amount of water but are included in our sample as part of the irrigated area. Therefore this system actually requires less water than we are indicating by our calculations here.
Pumping Costs:
The cost of pumping water can be calculated as follows:
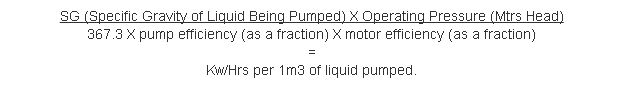
So we can calculate the annual pumping costs as follows:
Volume of liquid pumped per annum X cost per Kw/Hr of electricity.
For Sample A the Annual Pumping Cost is:

Annual Volume is 11,340 KL.
Assuming the cost of electricity is $0.16 per Kw/hr
The annual pumping cost for sample A = 11,340 X 0.43 X 0.16 = $780.19.
For Sample B the Annual Pumping Cost is:
Annual Volume is 8,598 KL.
Assuming the cost of electricity is $0.16 per Kw/hr
The annual pumping cost for sample A = 8,598 X 0.43 X 0.16 = $591.54.
Maintenance Costs:
Maintenance costs can be estimated to be as follows:
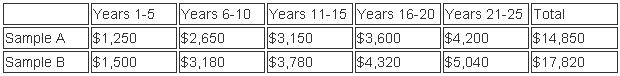
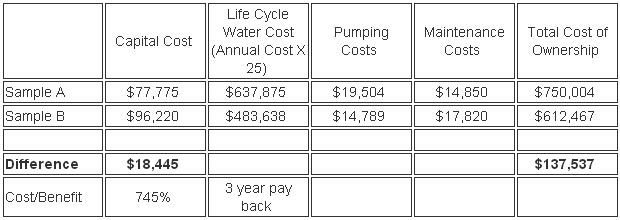
Summary of Irrigation System Costs
Note:
There is a slightly higher maintenance cost for Sample B
due to the larger number of valves and heads in the system.
Aqueduct Consultancy Design Methodology
The primary focus for Aqueduct Consultancy in designing irrigation systems is to generate systems with the highest possible efficiency and lowest cost of ownership over the systems life cycle. This is achieved through careful and tireless attention to detail in the design stages and meticulous attention to detail during the implementation inspection process.
This attention to detail results in irrigation systems which generate considerable savings in operating costs over the life of the system as well as being very water efficient. Additionally Aqueduct Consultancy applies many years of experience, knowledge and expertise into every design. In many cases there are additional circumstances that warrant particular attention.
The first step is the gathering of all relevant site information and client requirements. A detailed consultation with the client’s representative will discuss and determine many matters such as, but not necessarily limited to:
- Irrigated area
- Excluded areas
- Water source and water source data such as pressure and flow rates
- Water type (potable, recycled, stormwater etc.)
- Water storage facilities if applicable
- Site plans are sourced or the site is surveyed by GPS
- Any other matters that are considered relevant
The irrigated area and site information is collated and recorded and the most appropriate sprinkler is selected from the wide range of manufacturer’s, models and nozzles available. The right sprinkler is selected by determining which combination of brand, model, nozzle size, operating pressure, flow rate, radius of coverage and spacing best suits the particular application. Once the sprinkler is selected a draft design is generated for detailed assessment.
Once the draft irrigation design is completed a detailed assessment which considers all the relevant performance data is conducted. The selected sprinkler data (model, nozzle size, operating pressure and selected spacing) is entered into the Space Pro® programme. This programme provides specific irrigation system performance information. A combination of manufacturer provided and independently acquired sprinkler performance information is used to determine the Coefficients of Uniformity and Distribution of the draft irrigation system. The programme also provides a system application rate and more importantly for sports turf applications, a Scheduling Coefficient.
When the draft system performance figures from Space Pro® are considered acceptable the draft design is placed into Irricad®. The Irricad® programme provides optimum pipe sizing and provides further reports on system requirements and performance data figures. A system duty report is generated which details the pressure and flow rates required by the system at the water supply point on a station by station basis. It is this report that enables the correct pump selection for systems which are pump pressurised or the requirement at the water meter for systems supplied directly from potable mains.
Irricad® also provides detailed design reports which are an essential part of the overall system assessment. Irricad® reports on main line and lateral line flow rates, water velocities and pressure friction losses. A detailed Zone Design Report provides detailed information on the variation in operating pressures between sprinkler heads.
Once all the information and performance characteristics of the draft design have been confirmed as being acceptable and meet or exceed the exacting and specific standards set by Aqueduct Consultancy a final design is generated and presented to the client in AutoCAD® and/or PDF format. The final design will be suitable for the client to go to tender for the installation of the irrigation system.
Installation
At Aqueduct Consultancy we recognise that without proper installation the best designed irrigation system is destined to failure. It is for this very reason that we generate a Detailed Technical Specification for every design we complete. This detailed technical specification sets the ground rules for the installation of the irrigation system and is necessary in order to ensure that the completed irrigation system meets the exacting standards set by Aqueduct Consultancy and ultimately provides the client with an irrigation system which meets all their expectations of efficiency and effectiveness.
In addition to producing a Detailed Technical Specification Aqueduct Consultancy are committed to ensuring that systems we design are installed correctly. To this end we offer to conduct a series of check list inspections during the installation of the irrigation system. These checks are conducted at various stages during the system construction.
Detailed check lists are generated from the detailed technical specification and detailed design plans documentation and are conducted at each of the following stages of the system construction.
- Set out.
- Head works (pump stations, water storage, back flow prevention, filtration etc.)
- Main line installation
- Solenoid valves and associated components
- Lateral lines and sprinklers
- Commissioning
- Hand over
These check lists are designed to ensure that all aspects of the installation are completed properly and in accordance with Australian, Industry and Aqueduct Consultancy standards.
Summary
Significant savings can be made by the installation of irrigation systems that are designed to a more precise and exacting standard.
There is also of course a need for these systems to be installed as closely as possible to the intent of the design or the efficiency and effectiveness of the system will be negatively impacted. Irrigation systems should and can be installed to a level of tolerance which ensures that the intentions of the designer are met and the integrity of the effectiveness and efficiency of the system are maintained.
Hopefully I have been able to provide a better understanding of just what goes into the design of an effective and efficient irrigation system. At Aqueduct Consultancy we design to a standard and we continually assess our designs during the design process to ensure that we are meeting our own exacting standards.
We do a lot more than just join the dots on the piece of paper.